

All in One Offer! | Access Unlimited Courses in any category starting at just $29. Offer Ends in:

By : AWESOME EMMANUEL
Data Analytics & Visualization with Tableau Desktop...
4.8 191
6:1:29 hrs 27 lectures All Level

By : AWESOME EMMANUEL
Complete Data Analysis course with Microsoft Excel...
4.5 178
14:5:0 hrs 47 lectures All Level

By : Anshuman Tandon
Transforming Raw Data into Compelling Visual Stories...
4.8 161
3:3:14 hrs 20 lectures All Level

By : Paul Eastwood Harris
Including 2016 and 2013 ...
4 166
2:54:11 hrs 40 lectures Intermedite Level

By : Theodore Petrou
Continue your data analysis journey with Python by mastering the fundamentals of the ...
4.1 317
2:31:35 hrs 36 lectures All Level

By : Theodore Petrou
Begin your data analysis journey with Python by mastering the fundamentals of the pan...
4.3 168
1:26:56 hrs 28 lectures Beginner Level
By : Ahmad Sharifzadeh
For researchers...
4.1 607
3:30:6 hrs 45 lectures All Level

By : Junaid Ahmed
Learn Data, and IT Literacy Foundation Skills with live examples on three popular Ent...
4.7 9836
6:49:31 hrs 70 lectures All Level

By : Arthur Fong
QlikView Data Model, Visualizations & Expression in KPI Metrics & Financial Reporting...
4.6 5165
2:29:19 hrs 50 lectures All Level

By : SkillsOnDemand .
Create 6 Excel Dashboards - Learn Excel Data Analysis & Data Visualization with Pivot...
4 9444
5:1:57 hrs 48 lectures Expert Level


 Jazeb Akram
 John Hedengren
 Ranjan Pandey
 Pieter Vliegenthart
 Muhammad Ahsan Pervaiz
 Jerome P.
 Senol Atac
 Vikas Munjal
 Chandramouli Jayendran
 Prof. M. Higazi
 AWESOME EMMANUEL
AWESOME EMMANUEL
AWESOME EMMANUEL
 Anshuman Tandon
 Stephen Saxton
 Anna Clark
 Kamarthi Karthik
 Stephen Saxton
 ISAAC D GOTTLIEB
 LEMMY FRANCISCO KAWONGA
  Stephen Saxton
 Gerasimos Magoulas
 Gerasimos Magoulas
 Binary CodeSoft
  Binary CodeSoft
 Asif Hafeez
 Widhi Muttaqien
 Sarmad Jadoon
 Sarfaraz Mohammed
 Sarfaraz Mohammed
 AllQuant .
 LinCademy Training
 Sekhar Metla (Microsoft Certified Professional) Sudha
 LinCademy Training
 LinCademy Training
 Sanjay Kumar Singh
 Sanjay Kumar Singh
 Atul Kadlag
 Sanjay Kumar Singh
 Muhammad Ismail
.jpg) Muhammad Ismail
Muhammad Ismail Muhammad Ismail
 Sekhar Metla (Microsoft Certified Professional) Sudha
 Usama Hassan
 Rahim Zulfiqar Ali
 Pradeep Raj
 Kerron Duncan
 Biz Facility
Paul Eastwood Harris
Biz Facility
Paul Eastwood Harris
 Satyajit Pattnaik
 Ismaila Omeiza Mumuni
 Ismaila Omeiza Mumuni
 Rahim Zulfiqar Ali
 Theodore Petrou
Theodore Petrou
Theodore Petrou
 SkillsOnDemand .
 SkillsOnDemand .
 Satyajit Pattnaik
 Kathryn Tilley
 Ahmad Sharifzadeh
 Kathryn Tilley
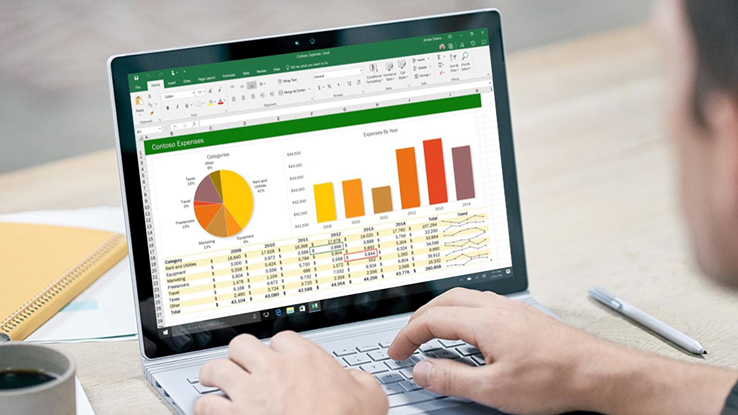
 Amey Karambelkar
Junaid Ahmed
Amey Karambelkar
Junaid Ahmed Bhollamanbhavani
 Arthur Fong
 Namita Devi
Arthur Fong
Namita Devi
Arthur Fong
 Daniel Alexandru Petrescu
 Daniel Alexandru Petrescu
 Jan Ekhteyari
 Rajesh Vydhala
 Mohammed Marwan
 Nikolai Schuler
  Kathryn Tilley
 Jan Ekhteyari
 Engr. M Khalid Husain .
 Rajesh Vydhala
 SkillsOnDemand .
 Chandramouli Jayendran
 Jan Ekhteyari
 Rajesh Vydhala
 Jan Ekhteyari
SkillsOnDemand .
Jan Ekhteyari
SkillsOnDemand . Chandramouli Jayendran
 Chandramouli Jayendran
 Wesam Qawasmeh
 Haytham Elmousalami
 Rahim Zulfiqar Ali
 Rahim Zulfiqar Ali
 Florian Fiducia
 Prashant Panchal
 Prashant Panchal
 Prashant Panchal
 SRINIVAS REDDY EXCELMAP
 SRINIVAS REDDY EXCELMAP
 MEHDI OUMOUSS OUMOUSS
 Abdelrahman Abdou
 Ross Maynard
 Taylor Croonquist
 Vardges Zardaryan
 Datahill Solutions
 Datahill Solutions
 Gaurav T
 Anurag Singal
 Vardges Zardaryan
 Prof. K Krahenbill
 Brian Jackson
 Brian Jackson
 Brian Jackson
 Brian Jackson
 Muhammad Ali Yasin
 Chip Reaves
 Daniele Protti
 Daniele Protti
 Deepesh Vashistha
 Phikolomzi Gugwana
Data analysis is the process of inspecting, cleaning, transforming, and modeling data to discover useful information, draw conclusions, and support decision-making.
In business, data analysis helps identify trends, patterns, and insights from data. It informs strategic decision-making, improves efficiency, and guides business operations.
Data visualization involves presenting data graphically. It aids in interpreting complex information, identifying patterns, and communicating insights effectively.
In research, data analysis helps researchers draw valid conclusions from their findings. It provides a systematic approach to interpreting data, validating hypotheses, and supporting research outcomes.
EDA plays a crucial role in data analysis by uncovering patterns, trends, and anomalies in the initial stages of investigation. It helps analysts form hypotheses, identify outliers, and make informed decisions on further analysis techniques.


